Given drug use data of several US states, we created a mathematical model that predicts the regions where opioid use originated and spread.
Abstract
We were tasked to offer insight to the Chief Administrator, Drug Enforcement Administration and the National Forensic Laboratory Information System by creating a mathematical model that predicts the regions where opioid use originated and spread.
With the model, we are asked to identify any possible locations where specific opioid use might have started in each of the five states, find what drug identification threshold levels do these occur and future predictions.
Additionally, we are asked to modify our model to account for socio-economic trends and come up with a resolution strategy to this crisis.
Introduction
As early as the late 1990’s there was a surge in the use of opioids, a drug intended to be used as a pain reliever, which has resulted in the death of thousands of Americans across the country. The highly addictive drug has left a devastating impact on the population, which has drawn the attention of many federal organizations to track the origins of the drug’s spreading and make predictions about the trend of the crisis. Socioeconomic statuses across different communities have been affected by the crisis, and present unique findings that can help explain the usage of opioids. This report will present the findings of identified patterns and characteristics through a mathematical model and offer insight into the ways that the opioid crisis could be countered.
Assumptions
Before building our model, we first came up with some assumptions about the data that we can base our model off of.
- When t = 0, or 2010, the highest number of drug reports is where the specific opioid use may have started in the state
- Every new drug report indicates a new drug addict
- Addicts are permanently addicts and do not return to a sober state (absorbing state)
- We grouped together each of the different drugs and assumed that they all have the same effect on an individual
- Total drug reports are cumulative, meaning that each year’s total synthetic opioid and heroin reports are a new group of addicts
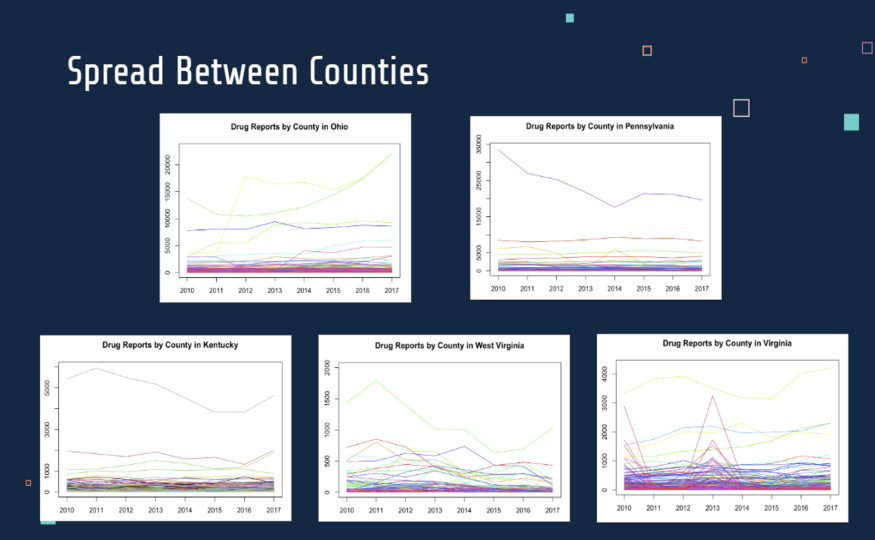
Early Data Analysis
In order to find potential sources of opioid usage in the United States, we plotted the number of drug reports per year for all of the states in our data. We hoped to find states with patterns showing either the growth of opioid usage or decline. If we found any declining patterns, it’s possible that that state was a source of opiate usage as drug addicts were leaving on mass. Even if it was not a source, we can analyze other trends to see what’s correlated with drug use. Similarly, if we found any growing patterns, we can analyze the data to see what factors were contributing to opioid usage.

Here we found the states with the most notable growth or decline trends. In order to further narrow the location information down to the county level, we analyzed the drug reports per year data for all of the counties of these states.

Based on these plots, we decided to focus on Ohio and Pennsylvania, as they showed the most drastic patterns along with large sample sizes. Within those states, we found that Philedelphia County in Pennsylvania and Hamilton County in Ohio were the counties that represented the most change in drug usage over the years.
Building Models
After chosing Hamilton, Ohio and Philadelphia, Pennsylvania as our counties of focus, we built our initial models using a modified SIR (susceptible, infected, removed) model, tuning our hyperparameters, beta and sigma, and population data based on our data.

After building our initial models, we proceeded to adapt our models based on the variables that we thought intuitively made the most sense when discussing drug use. Those variables were Household Type, Relationship Status, Marital Status, Educational Attainment, Veteran Status, Disability Status, Language Spoken At Home, and Ancestry.
To reduce our models’ complexity, we analyzed all of the aforementioned factors, comparing the Philadelphia County data with the Hamilton County data to determine which of those factors contributed to drug usage the most. We settled on Marital Status after observing sizable differences between the Marital Status plots of each county.

Using Marital Status data, we refined our initial model (left) and built our final model (right, black) which closely resembles the real data (right, red).

We applied the same strategy to the Pennsylvania data and created our final model for Pennsylvania below.

Recommendations
With everything in mind, we suggest that all opioid addicts get transferred to isolation centers as soon as possible. Being that new opioid cases are happening everyday, this means that there will still be opioid users out in public, except it will be a proportion that is way smaller than the original population. To account for this, we assume that there will still be about 1000 opioid users out in the public who have not yet been transferred to a rehab facility. Since there are way less users who can possibly expose others, both sigma and beta from our modified SIR model significantly go down.
After incorporating these modifications to our models, we ran the simulation again to predict future trends now with the integrated solution.

Here, the time in days represents the number of days after the last date in 2017.
Conclusion
Our initial SIR models gave insight into when the states would reach a certain carrying capacity and the duration it would take, but it failed to incorporate the impact that socio-economic factors have on the data. We looked at the individual drug reports of each county in the five states with the most notable drug use trends and noticed that each state had a particular “dominant county” that strongly represented the overall behavior and growth of opioid use in the state. Using this, as well as taking account of the socio-economic impact of the data by incorporating marital status into the model, we created a refined model that more accurately represented the data and growth or decline of opioid use in each state. In our research, we specifically looked at the states of Ohio and Pennsylvania because they had the largest sample size and most distinct shape of their data. When we plotted the new model against the statistics for the total drug reports in Ohio and Pennsylvania, its progressively growing sigmoid curve tightly followed and modeled the presented data, implying that this model was successful in how it predicts the trend of opioid use. From the model and using the dominant counties we were able to discern and validify patterns of opioid use that suggest the possible locations where opioid use may have started.